Therapy Response for Solid Tumors
Every cancer patient wants to know:
Is my therapy working?

Treatments don’t always work.
When treating most solid tumors, the best way to tell if therapy is on track is from the molecular insight into the metabolic or proliferative activity of the tumor provided by PET/CT imaging.
However, most payers limit the number of PET/CT scans that will be reimbursed. Other treatment response measurements (CT, MRI, palpation) don’t provide the timeliest feedback. They measure size, a trailing indicator of the tumor’s response to therapy.
Lucerno’s technology provides insight
Lucerno’s investigational technology requires minimal radiation and is intended to let the clinician know early in the treatment cycle if the tumor is responding. If it is, stay the course. If not, consider other treatments. Good for the patient, the oncologist, and the payer.
Lucerno’s system gives molecular insight
PET/CT scans provide a molecular insight snapshot in time by capturing the positron emissions from injected radiotracers. These scans are a primary tool for pre-therapy staging of a patient’s cancer.
Based on the tracer’s mechanism of action, molecular imaging measures the metabolic or proliferative condition of cancer cells by capturing the tracer emissions. Molecular imaging is also rapidly becoming the most advanced tool for oncologists and researchers to monitor tumor response to treatment.
Lucerno’s investigational technology also provides molecular insight over time. This kinetic measurement of the uptake of radiotracers is done quickly, easily, and inexpensively. It is intended to provide oncologists with insight into how cancer cells are responding to treatment.
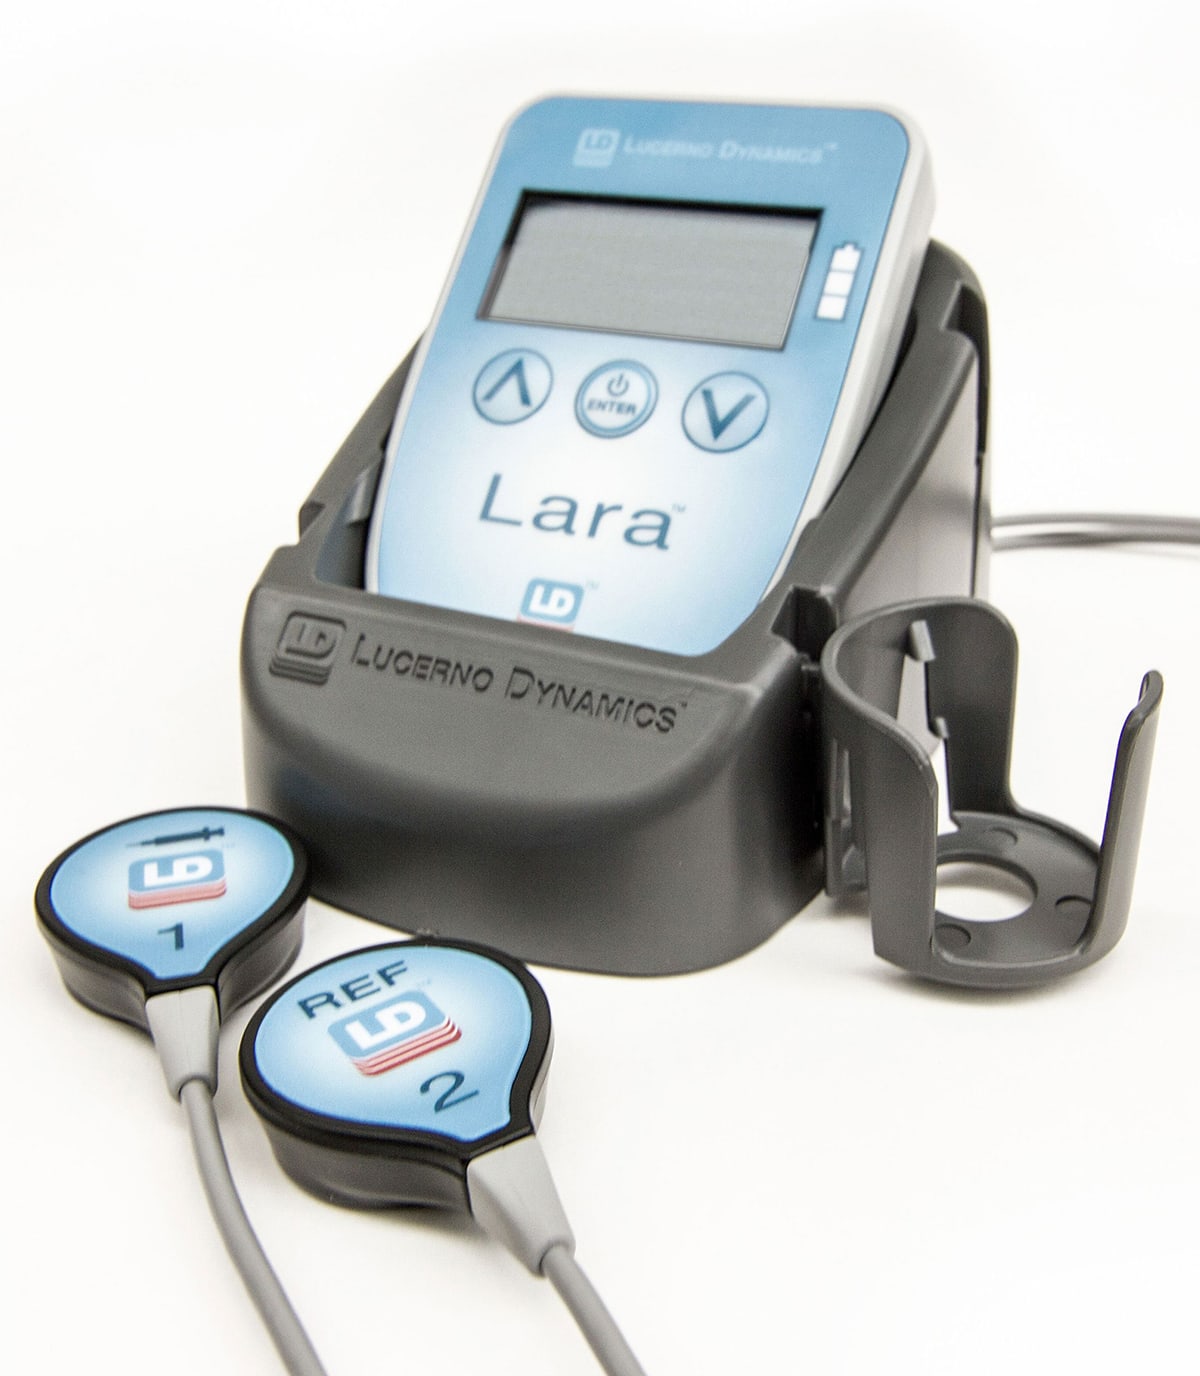
Lucerno Lara® System
The Lucerno Lara System has been and can be used under an investigational device exemption for therapy response. It uses surface sensors to measure the radiation emitted from an area of interest. One sensor for the tumor, one sensor for each bicep, and one for another location of interest (secondary tumor, liver, etc.). The system is completely passive–it emits no energy.
A baseline Lucerno scan is done at the same time as a staging PET/CT scan. The sensors are applied to the patient prior to radiotracer injection, and collect dynamic uptake data from four target areas during the pre-PET uptake waiting period. The sensors on the biceps act as a control and provide information regarding the quality of the injection, while the sensor over the tumor provides insight into tumor uptake. 2-3 minutes of extra work, no extra radiation, and results available within minutes of the completed scan.
In clinical studies, the Lucerno system has been used early and frequently in the treatment process to evaluate the systems’ ability to assess tumor response to therapy.
Quantified results. Early. Fast.
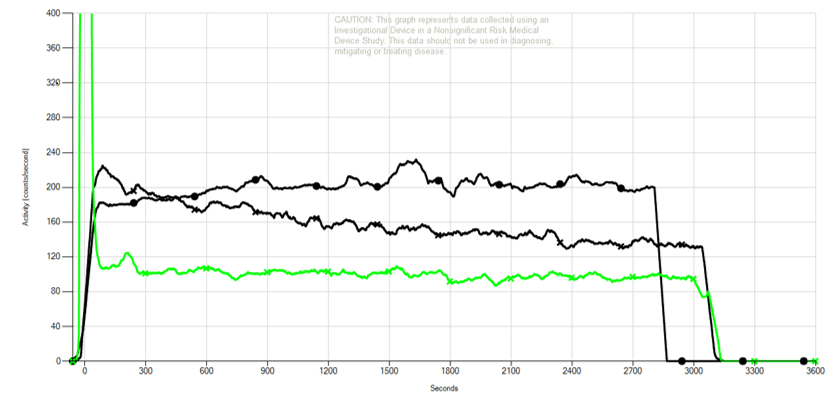
The Lucerno graph to the right is from a neoadjuvant breast cancer patient in an investigational study. A Lucerno scan early in therapy showed the metabolic activity of the tumor area of interest had been greatly reduced.
- Upper black line is baseline scan, pre-therapy.
- Lower black line is follow-up scan, after 2 cycles of therapy.
- Green line shows injection arm sensor result.
- Area Under the Curve (AUC) change of -25% between the 2 black lines indicates the area of interest is less metabolically active.
- The patient’s tumor was excised 7 months after the follow up scan. The pathology report showed complete response.
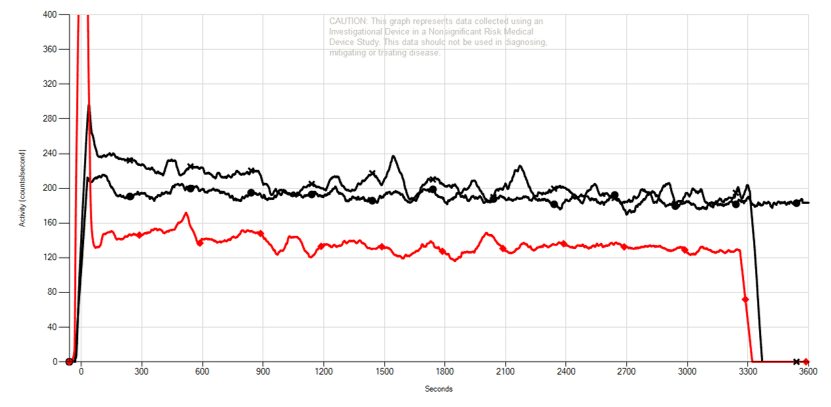
The Lucerno graph to the left is from another neoadjuvant breast cancer patient in an investigational study. A Lucerno scan early in therapy showed the metabolic activity of the tumor area of interest was stable or had slightly increased.
- Upper black line is follow-up scan, after 2 cycles of therapy.
- Lower black line is baseline scan, pre-therapy.
- Red line shows injection arm sensor result.
- AUC change of +6.8% indicates the area of interest is likely more metabolically active.
Unfortunately, therapy was not successful for this patient.
Would you like to incorporate Lucerno technology into a study?
Contact UsThis application has not been cleared or approved by the FDA and is limited by United States law to Investigational Use.