Quality Control
Quality control of administrations is especially important for nuclear medicine procedures
Lara provides the quality control needed to ensure nuclear medicine procedures have not been compromised by an extravasation. Since Lara sensors record the relative level of radiotracer in the areas of interest during and after the administration, Lara provides clinicians with evidence of the presence of radiotracer in the administration area during the uptake process.
Real-time display enables clinicians to mitigate the effects extravasation right away. Time-activity curves (TAC) provide additional insight to help clinicians evaluate the quality of administrations. These TACs are easy to store in a picture-archiving system (PACS) as a part of the patient’s record.
Real time data
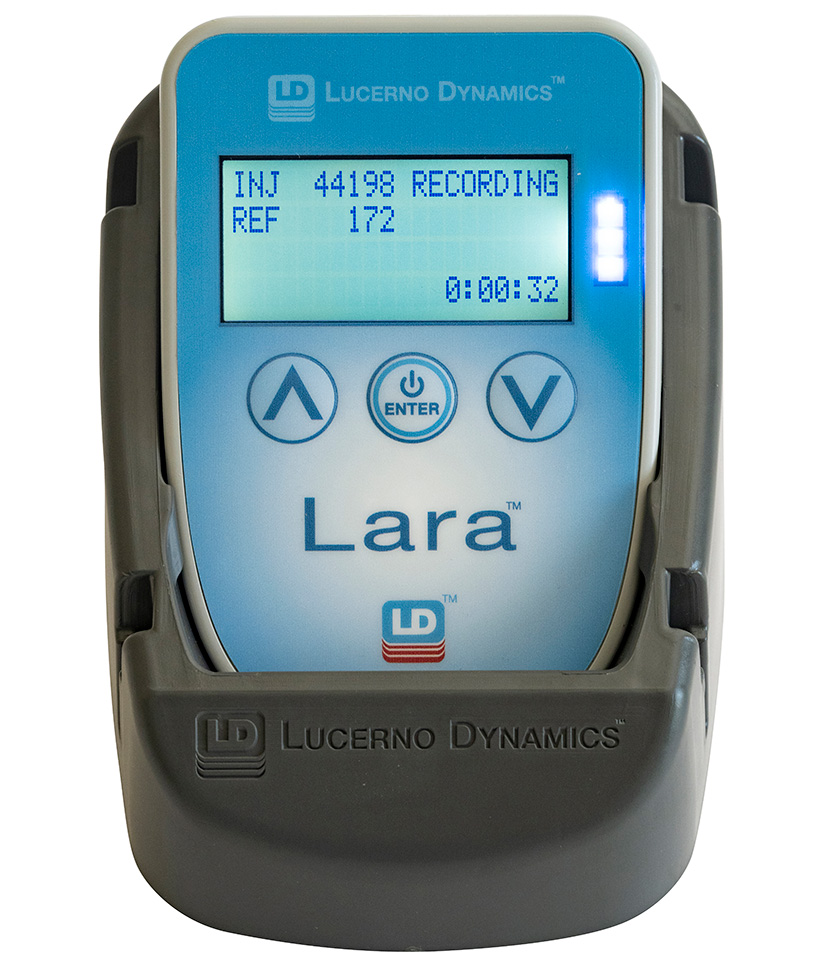
Lara’s real-time display provides immediate feedback to technologist on the quality of administrations. Lara displays second-by-second counts from each connected sensor on an LCD as well as the elapsed time since the administration began.
Lara with Real-Time Visualization provides the same second-by-second count information from each sensor in a graphical time-activity curve format on a computer monitor.
When performing bolus administrations, the technologist can glance at the real-time LCD display or computer monitor to know immediately if there may be a problem with administration. A difference between injection and reference sensor counts indicates possible residual radioactivity. If the clinician suspects extravasation, they can begin mitigation immediately.
When performing infusions, the technologist can use the real-time LCD display or computer monitor to provide additional information regarding the quality of the administration.
Time-Activity Curve
The counts shown on real-time display are recorded to produce a graph. Clinicians can use these TACs to further evaluate the quality of administrations.
Confirming Ideal Administration
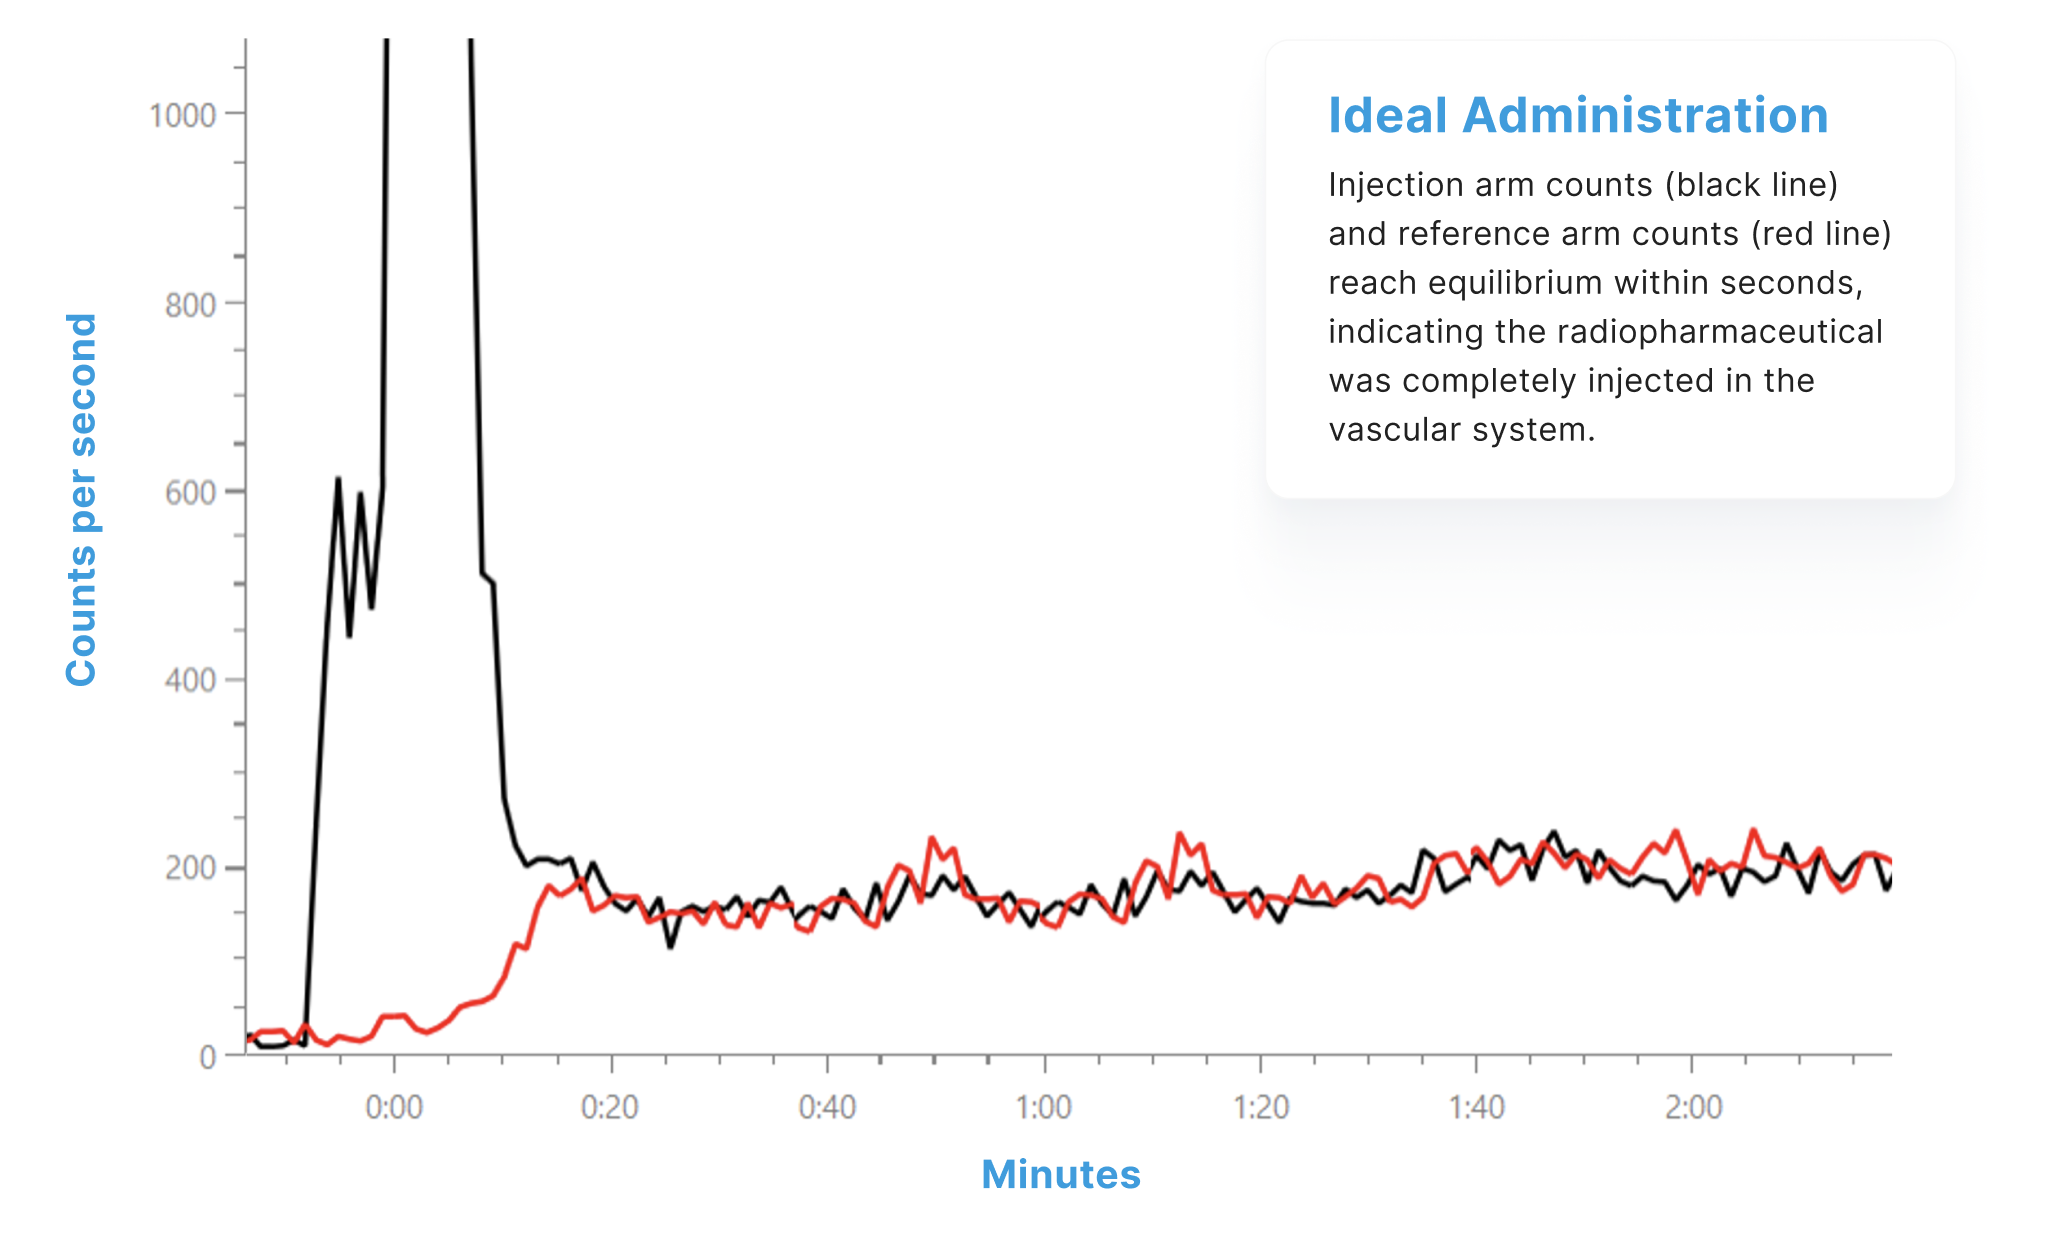
The Lara graph below shows an ideal administration. Note that the injection arm sensor curve (black line) and the reference arm sensor curve (red line) reach equilibrium within seconds. All diagnostic nuclear medicine administrations that use a bolus injection should result in TACs that look like this one.
Revealing an Extravasation
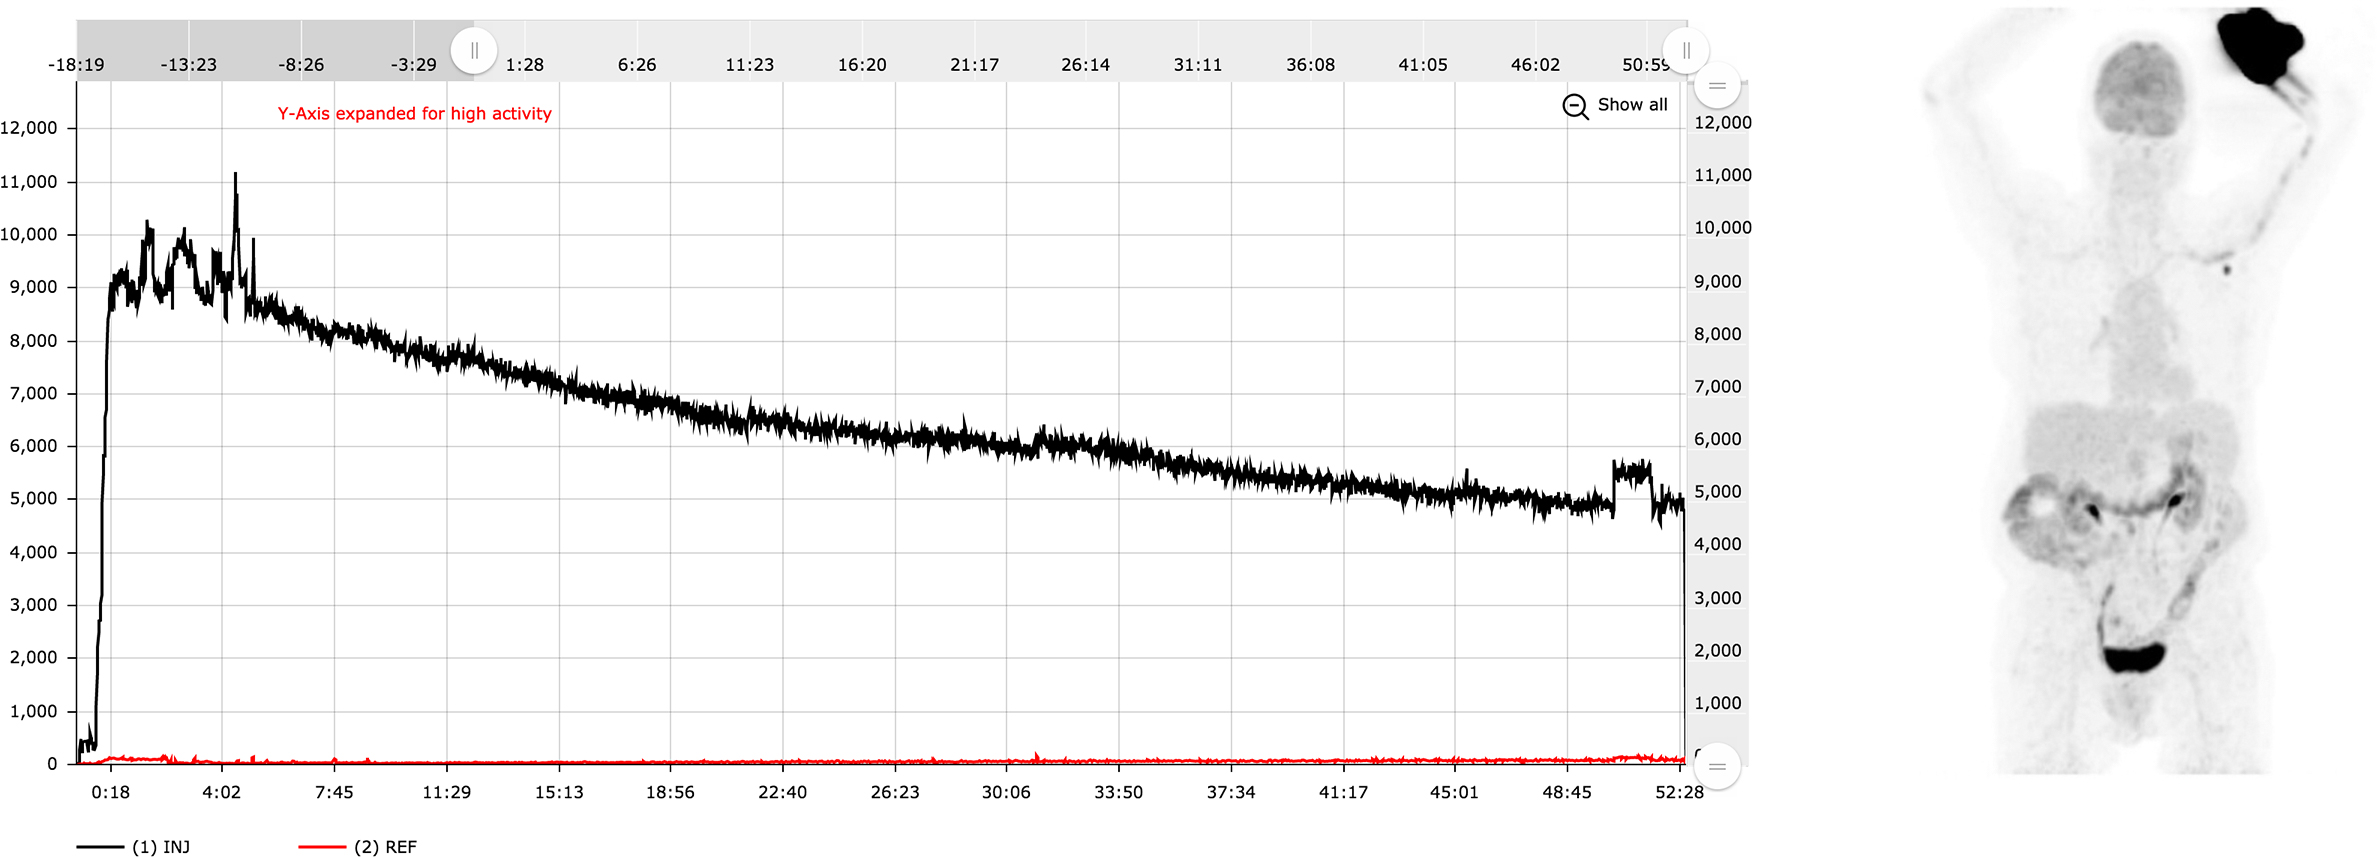
The black line in the time-activity curve (below left) indicates a significant level of radioactivity near the injection arm sensor. The red line indicates the level of activity near the reference arm sensor. In the case shown below right, the technologist reviewed the time-activity curve prior to imaging the patient and decided to include the administration site in the imaging FOV because they suspected extravasation. The director of the PET center confirmed that the extravasation was significant after measuring the remaining activity near the administration site using the static images.
Revealing Prolonged Venous Stasis
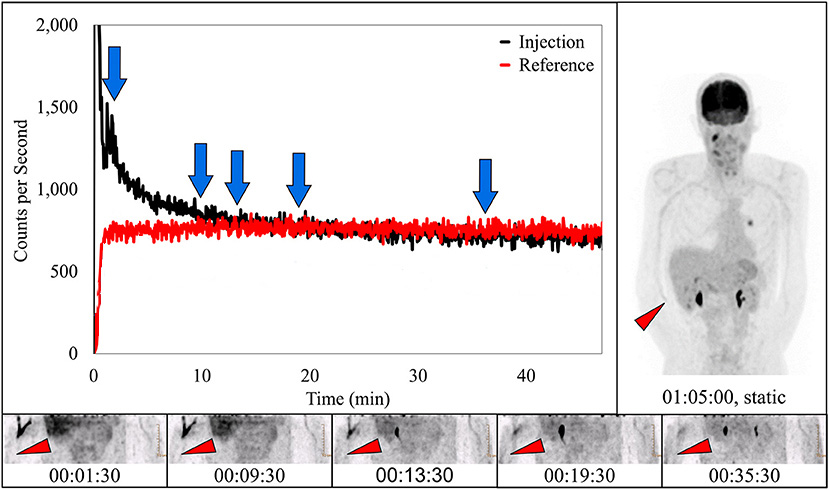
In the time-activity curve below, at the time of imaging the injection arm sensor and reference arm sensor outputs are very similar. A static image of the administration site could lead clinicians to believe the radiopharmaceutical was ideally administered when in this case, prolonged venous stasis delayed the delivery of the radiopharmaceutical. The Lara® System can alert clinicians that the radiopharmaceutical was not delivered as intended, while the static image suggests an ideal administration. A static image alone is not enough.
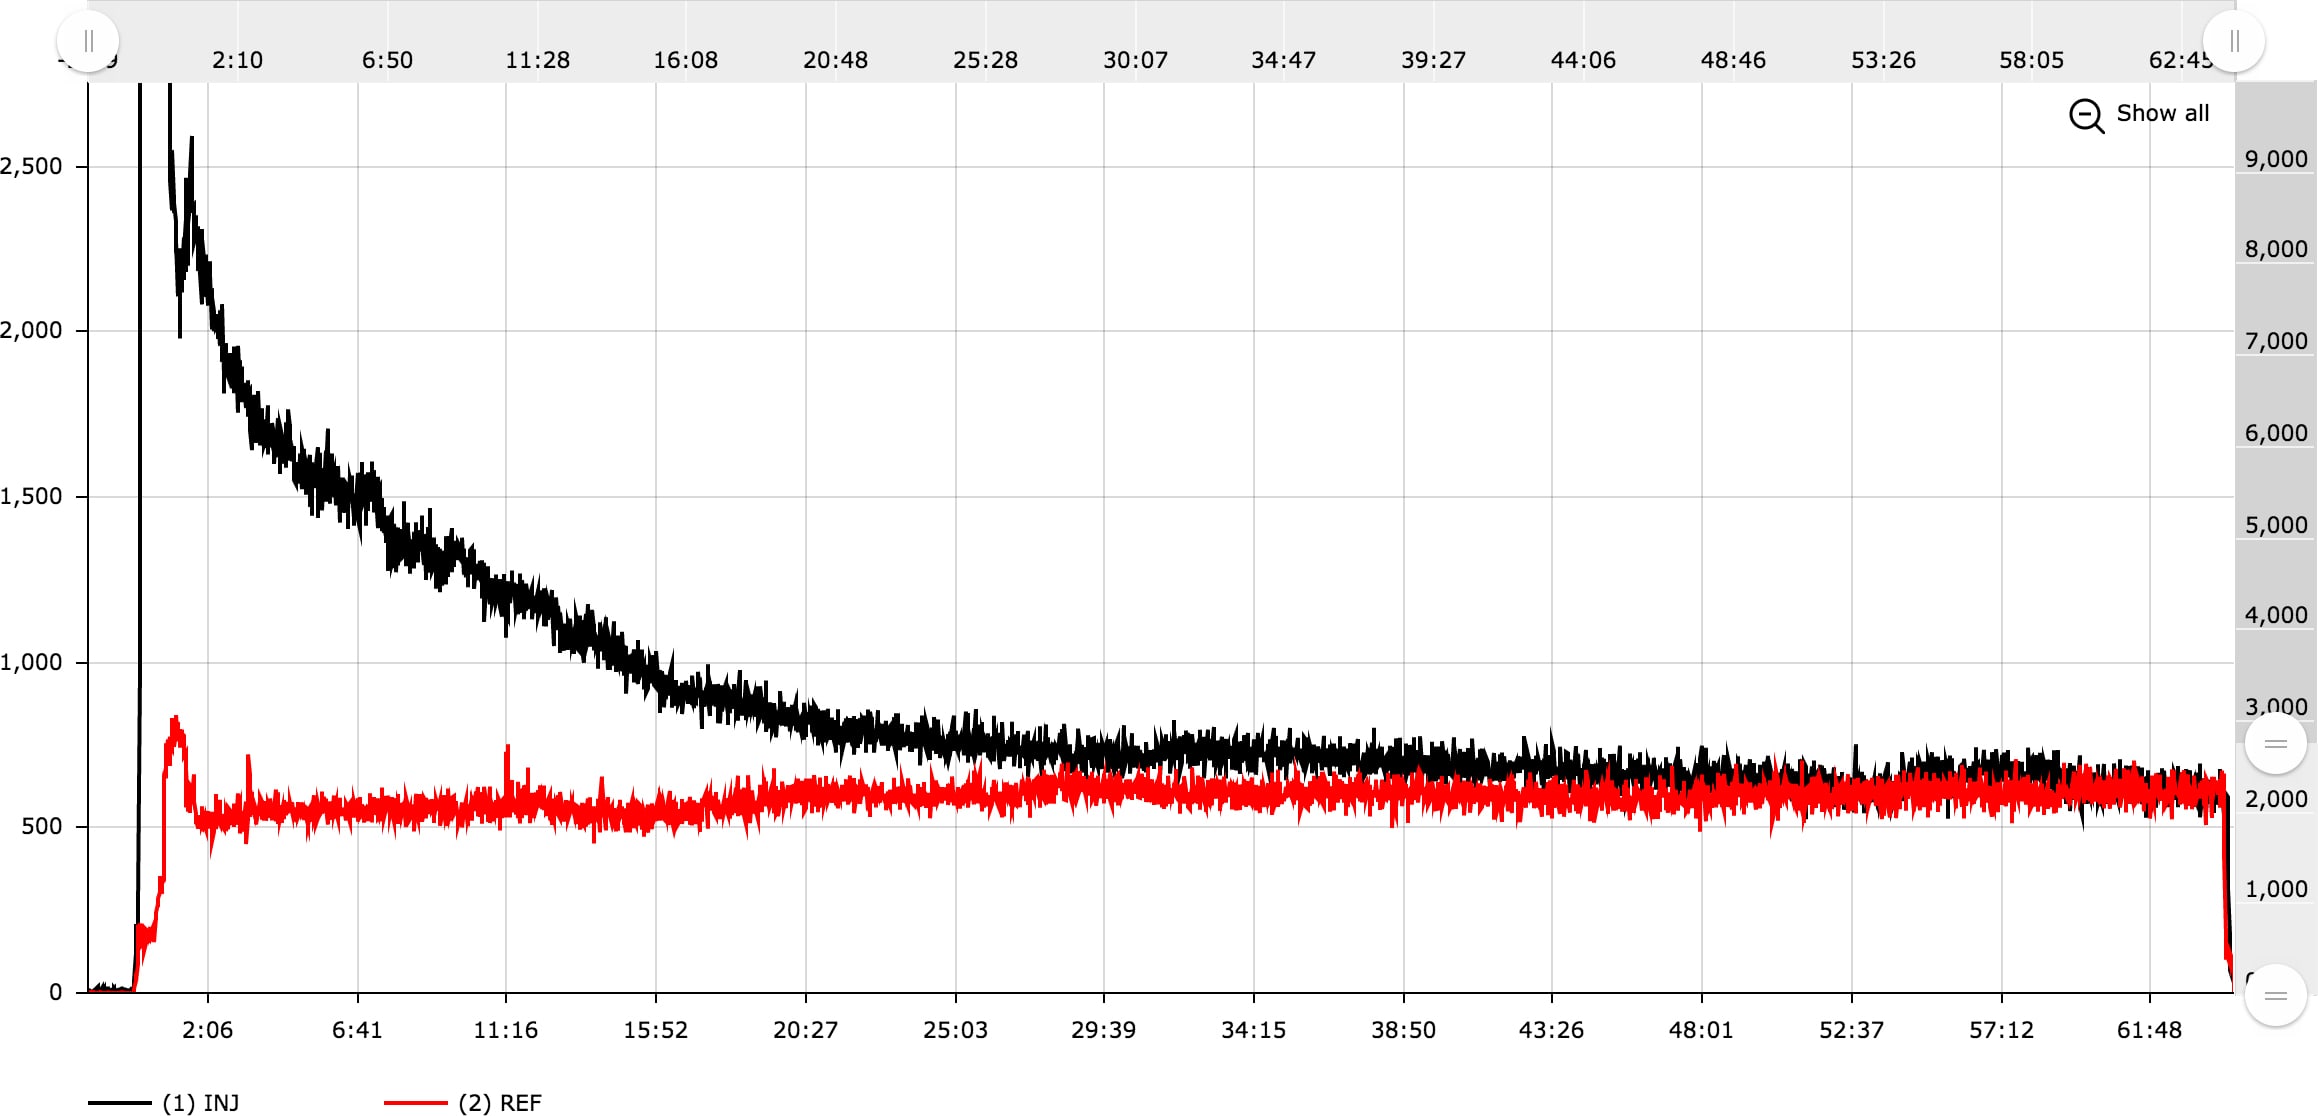
The figure below illustrates the clearance of a venous stasis during an uptake period. Dynamic PET images (bottom row) clearly show progressive clearance of residual radiotracer in the vein. The time of each dynamic image corresponds to a blue arrow on the injection TAC (black). The red TAC reflects activity captured by the reference arm sensor on the non-injection arm during the uptake period. Red arrows on the images indicate the approximate administration site (right antecubital fossa).
By providing vital quality control information regarding the administration, the Lara System provides clinicians what they need to determine if an extravasation has occurred and additional information to help characterize the severity. This knowledge helps determine the level of confidence clinicians can have when making patient management decisions based on the nuclear medicine imaging or therapeutic response. If an extravasation has occurred, clinicians can use Lara information to help characterize the absorbed dose delivered to the patient’s arm tissue.
When patients are extravasated it is important to characterize extravasation.