Lara®
Real-Time Visualization (RTV)
Lara RTV provides second-by-second feedback: ideal for high-dose radiotherapy administrations
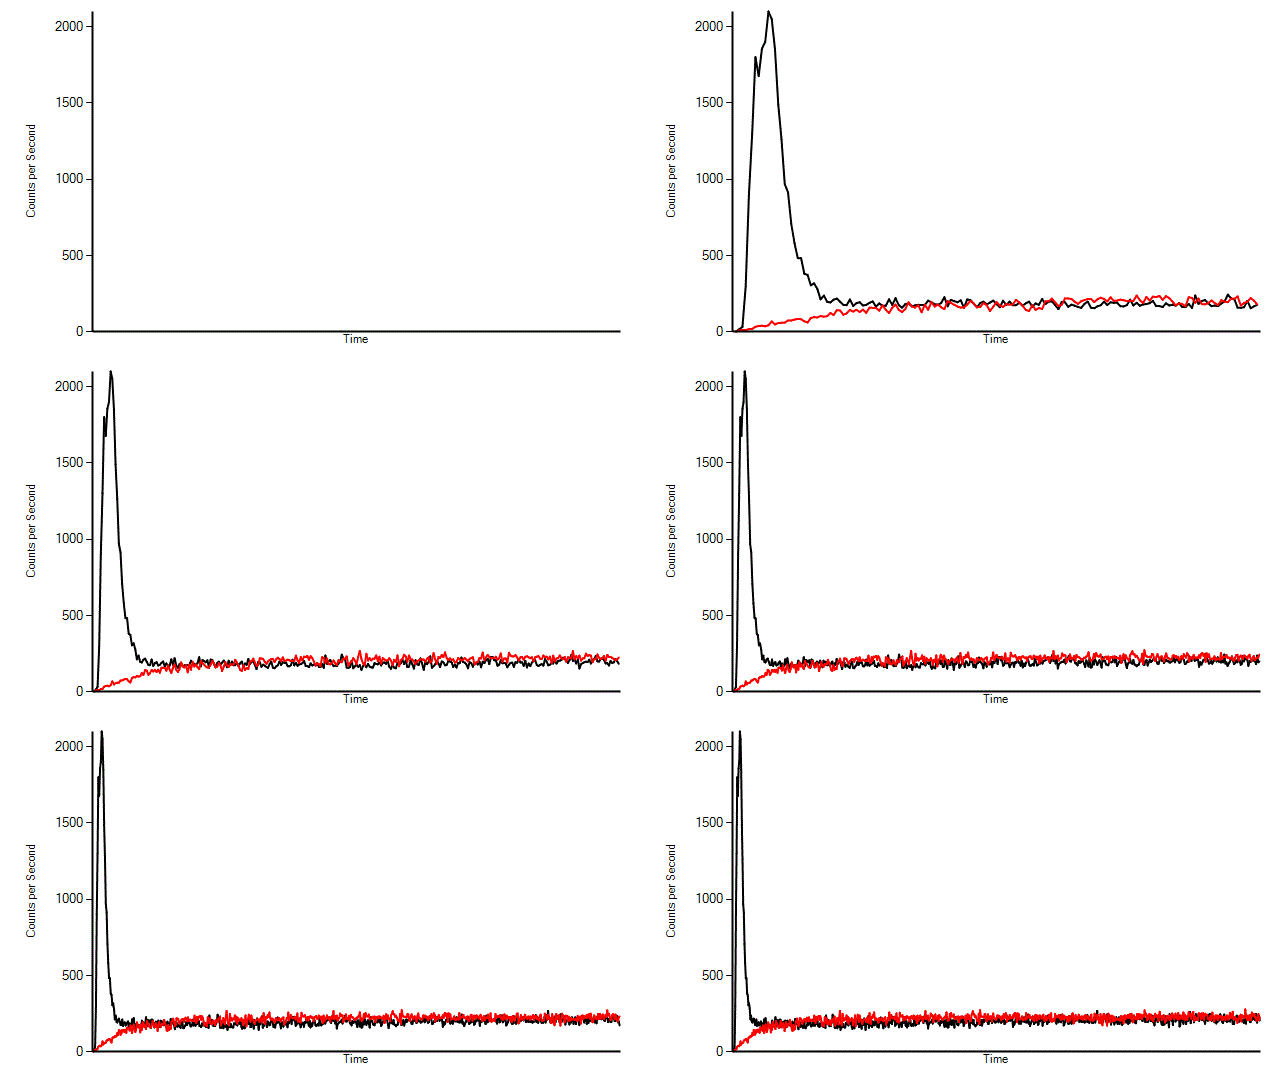
Lara RTV can be used with any method of therapy administrations
Infusion
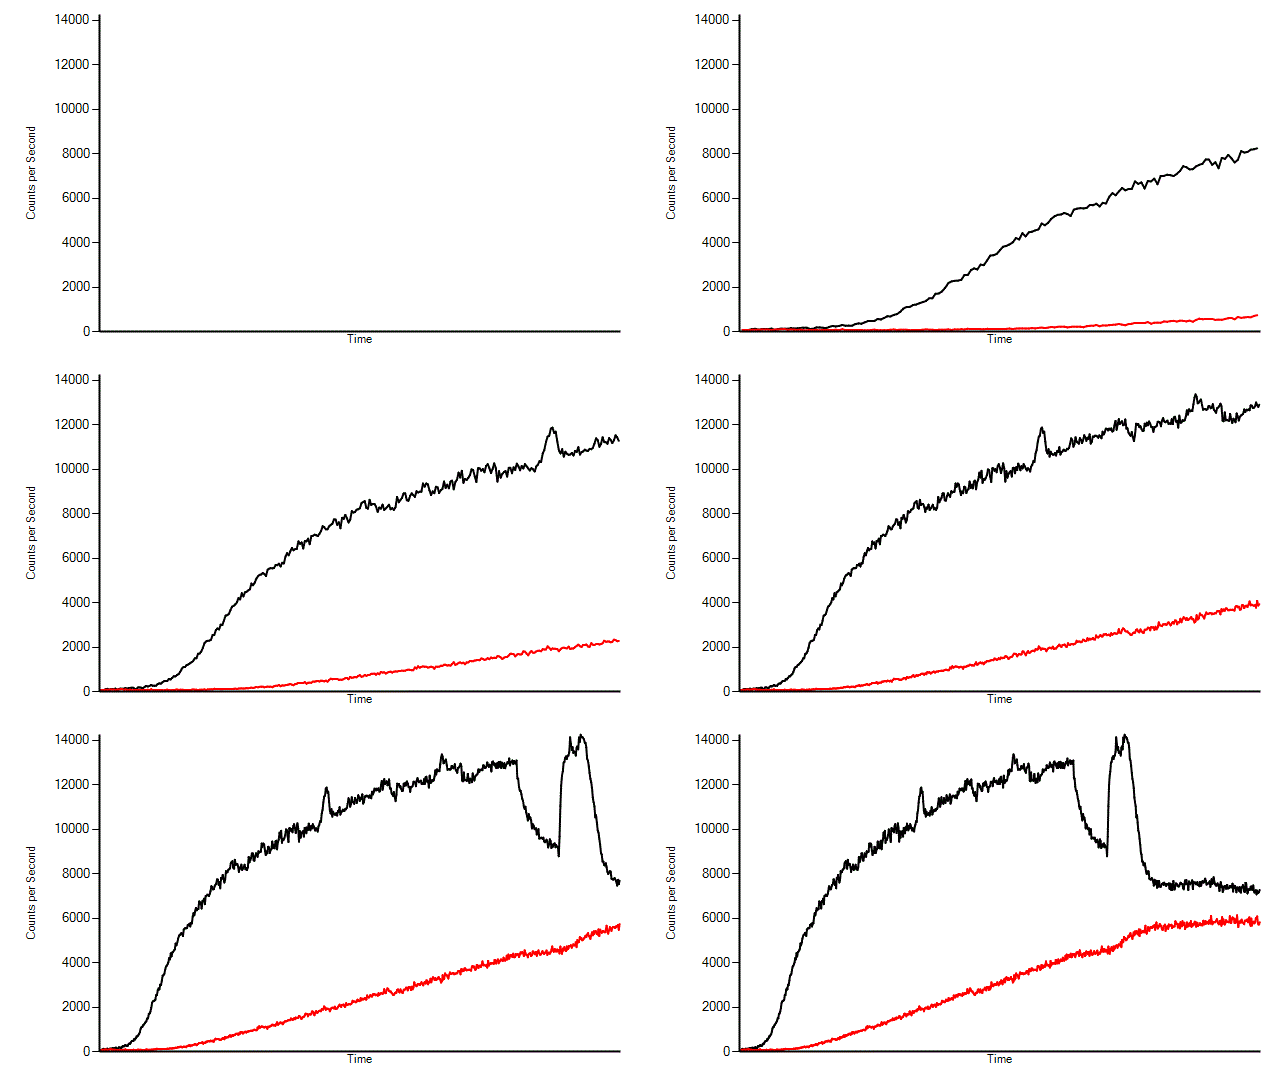
Bolus
Introducing Lara RTV with Control Charts
- previous center-specific proven ideal administrations
- previous ideal administration by each technologist
- preferences of the Authorized User
- guidance from radiopharmaceutical manufacturers
- other information to be determined by customers
Control Chart Benefits
- Early warning system to alert technologists that their administration may have been extravasated
- Minimizes accidental radiation exposures to patients
- Ensures and documents effective delivery of therapy
- Prevents waste of expensive radiotherapeutics
Control Chart Examples
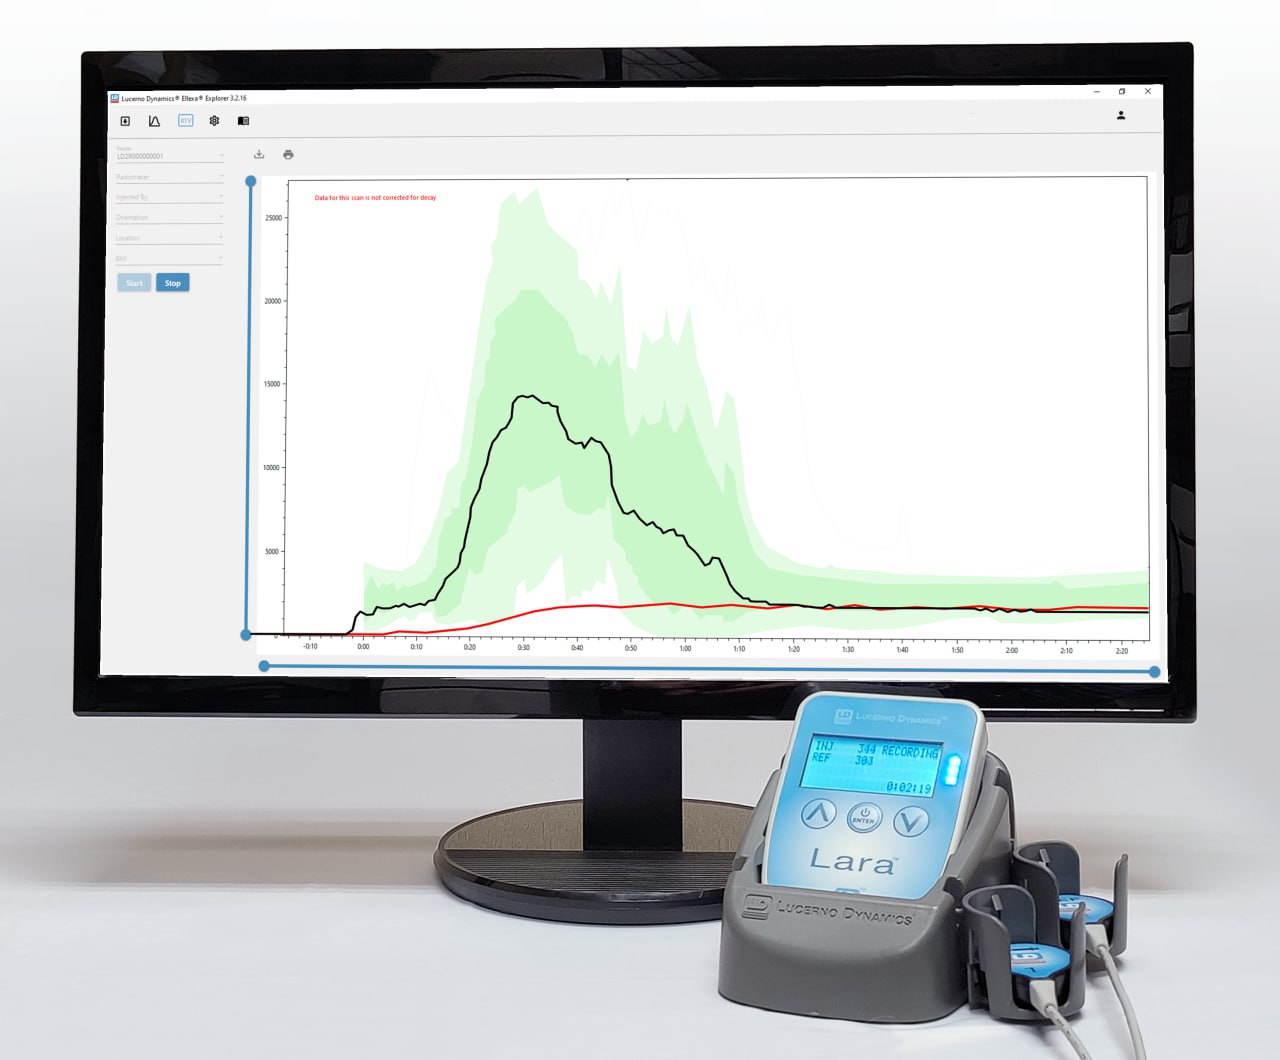
This is a realistic example of an ideal radiopharmaceutical administration based on actual administrations.
The Lara sensor data from the administration arm (black line) remains within the dark green Control Chart area representing one standard deviation. It then drops to a level consistent with the reference arm sensor data (red line) indicating the administration was likely to be systemic with no residual radioactivity left at or near the injection site.
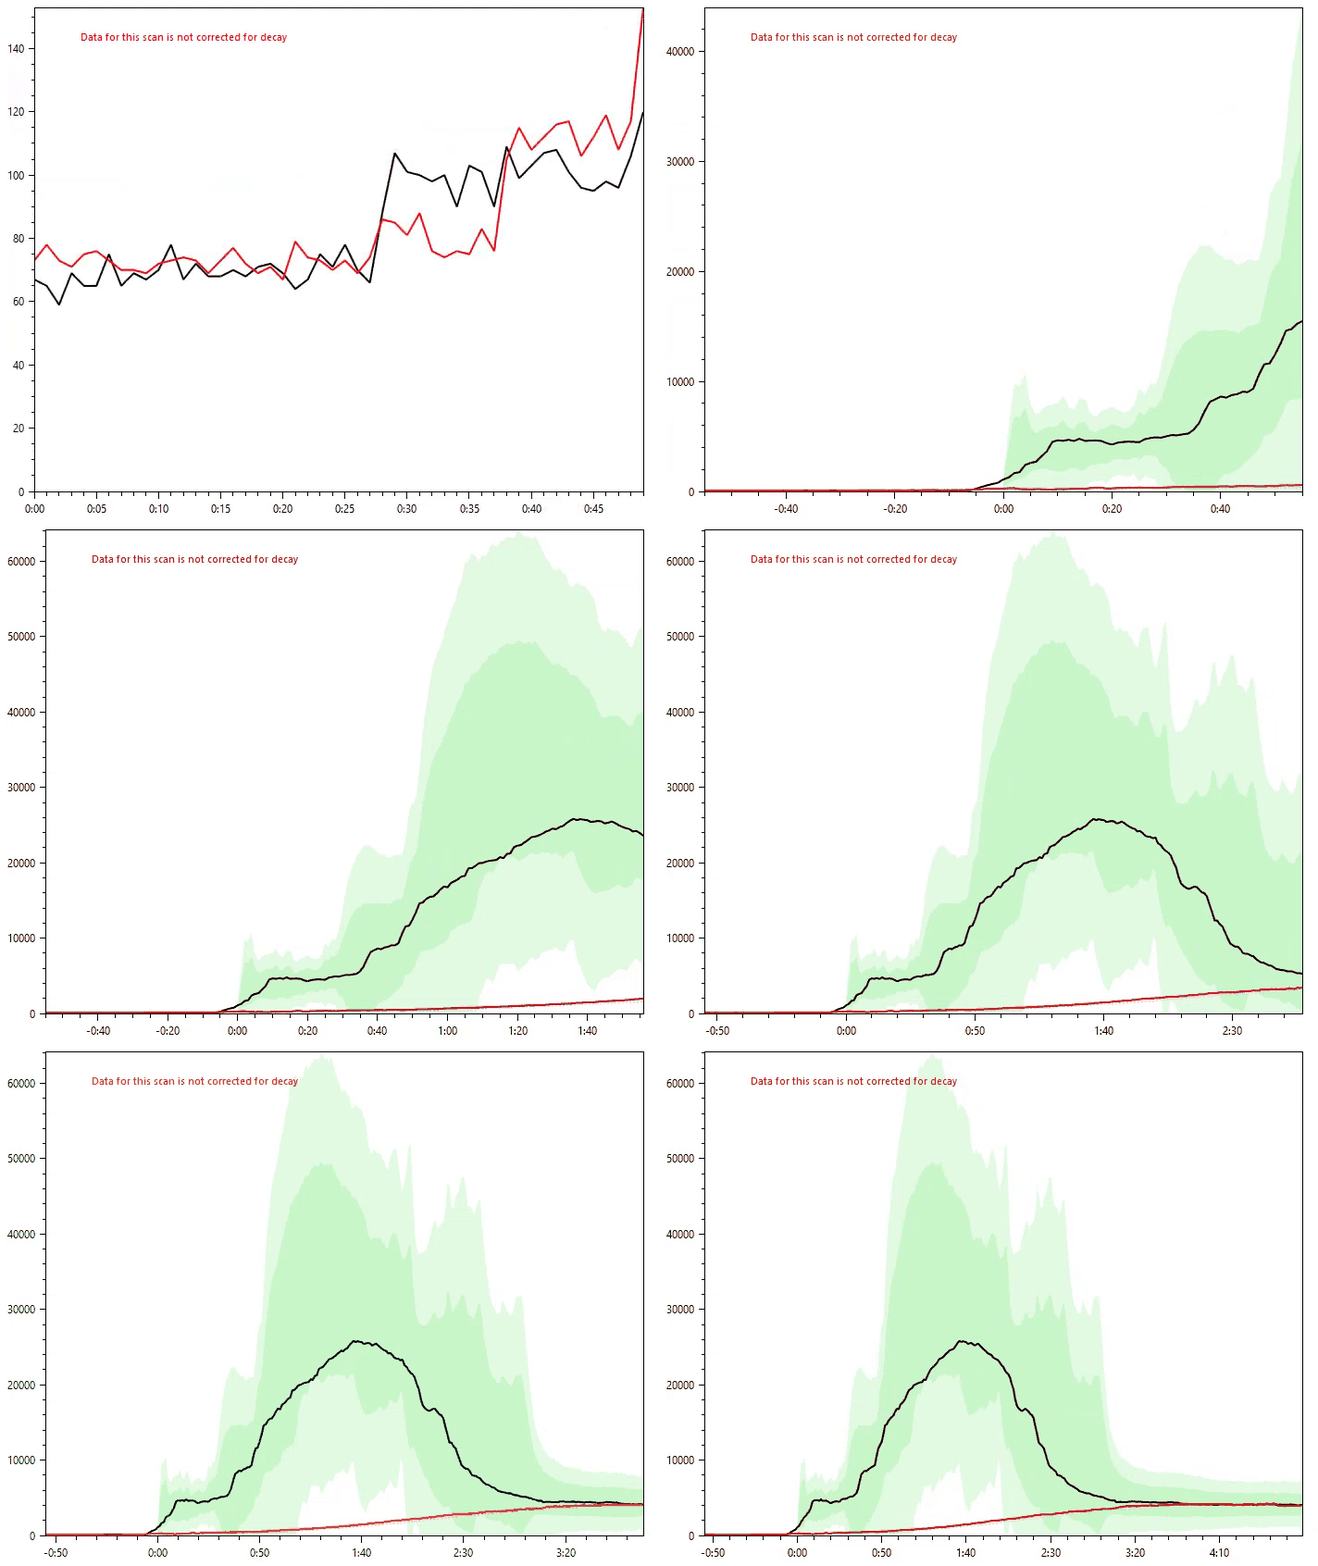
At time 2:15 in this example, the administration is completed, and the Lara RTV TAC decreases rapidly. The next several seconds represent the technologist preparation of a saline flush. The flush can be seen as the peak at time 2:30.
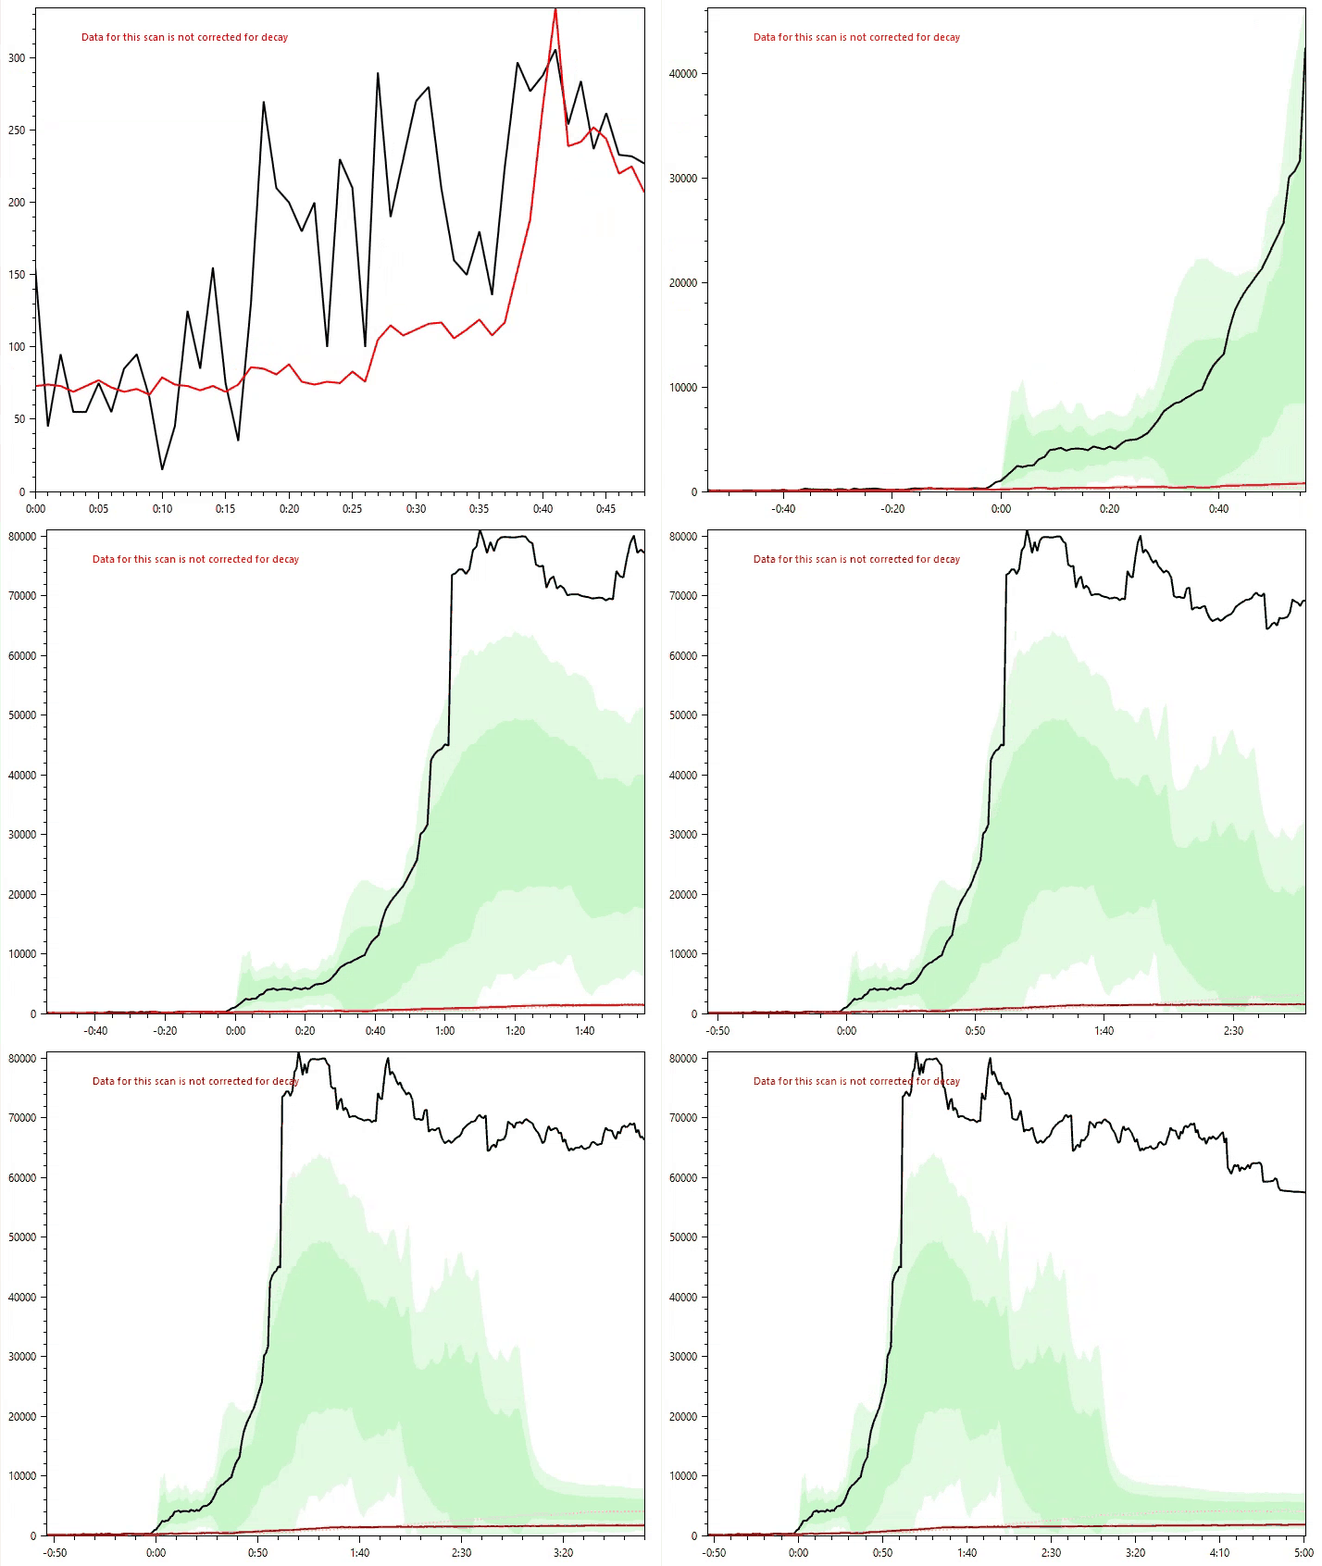
This is one example of a non-ideal radiopharmaceutical administration, likely caused by a venous access issue that led to an extravasation.
The Lara RTV TAC indicates that output from the administration arm sensor (black line) rises as the administration starts. At time 0:45, the black line passes out of the first standard deviation and by time 0:50 passes through the light green Control Chart region representing 2 standard deviations. In an actual administration, if the TAC passes through the Control Chart regions, the technologist may want to consider pausing to assess the quality of the administration.
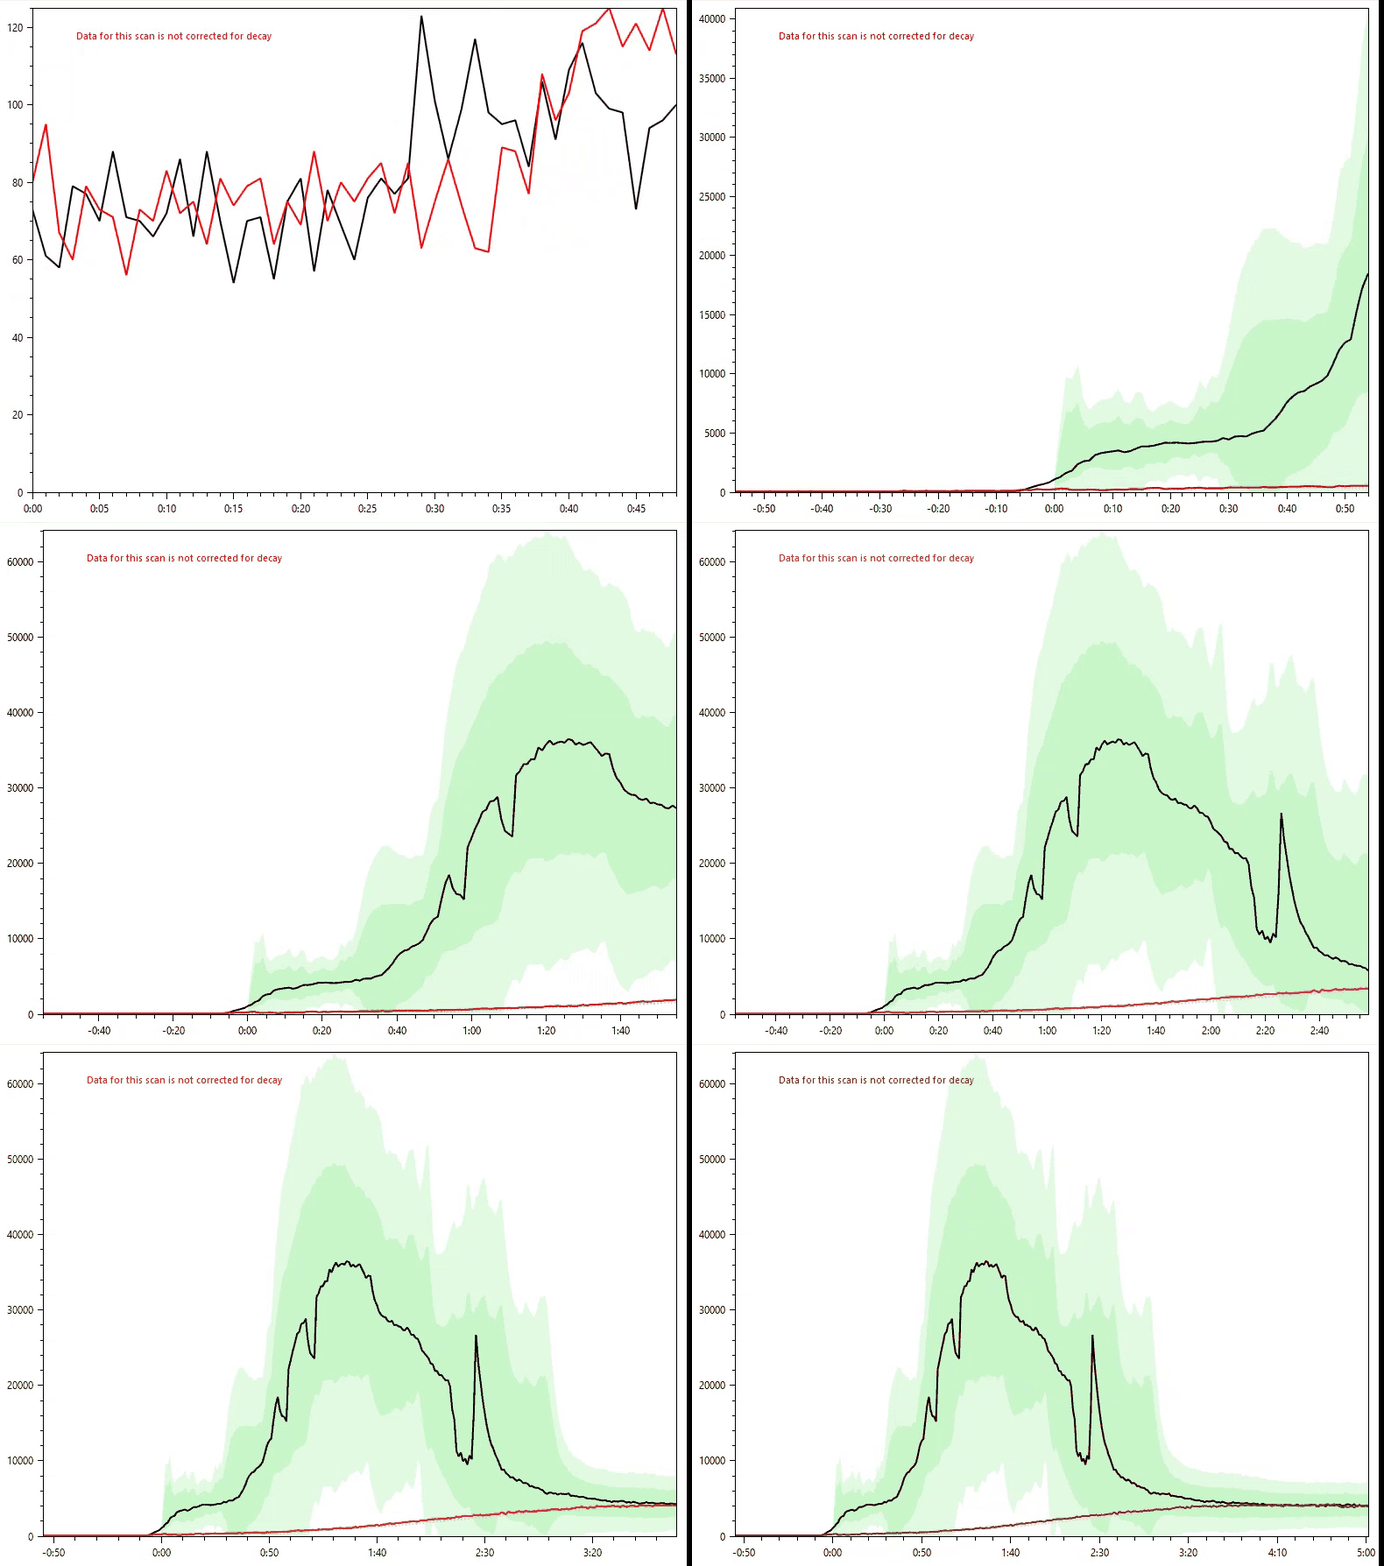
This is another example of a non-ideal radiopharmaceutical administration, based on a real-life extravasation likely caused by a blown vein during the administration.
In this example, the Lara RTV TAC indicates that output from the administration arm sensor (black line) rises as the administration starts. At 1:00, the technologist begins a series of pauses. Each pause results in less radiotherapeutic passing through the vein underneath the Lara sensor. Therefore, the RTV TAC decreases and confirms patent venous access. Subsequent pushes by the technologist causes the RTV TAC to increase.
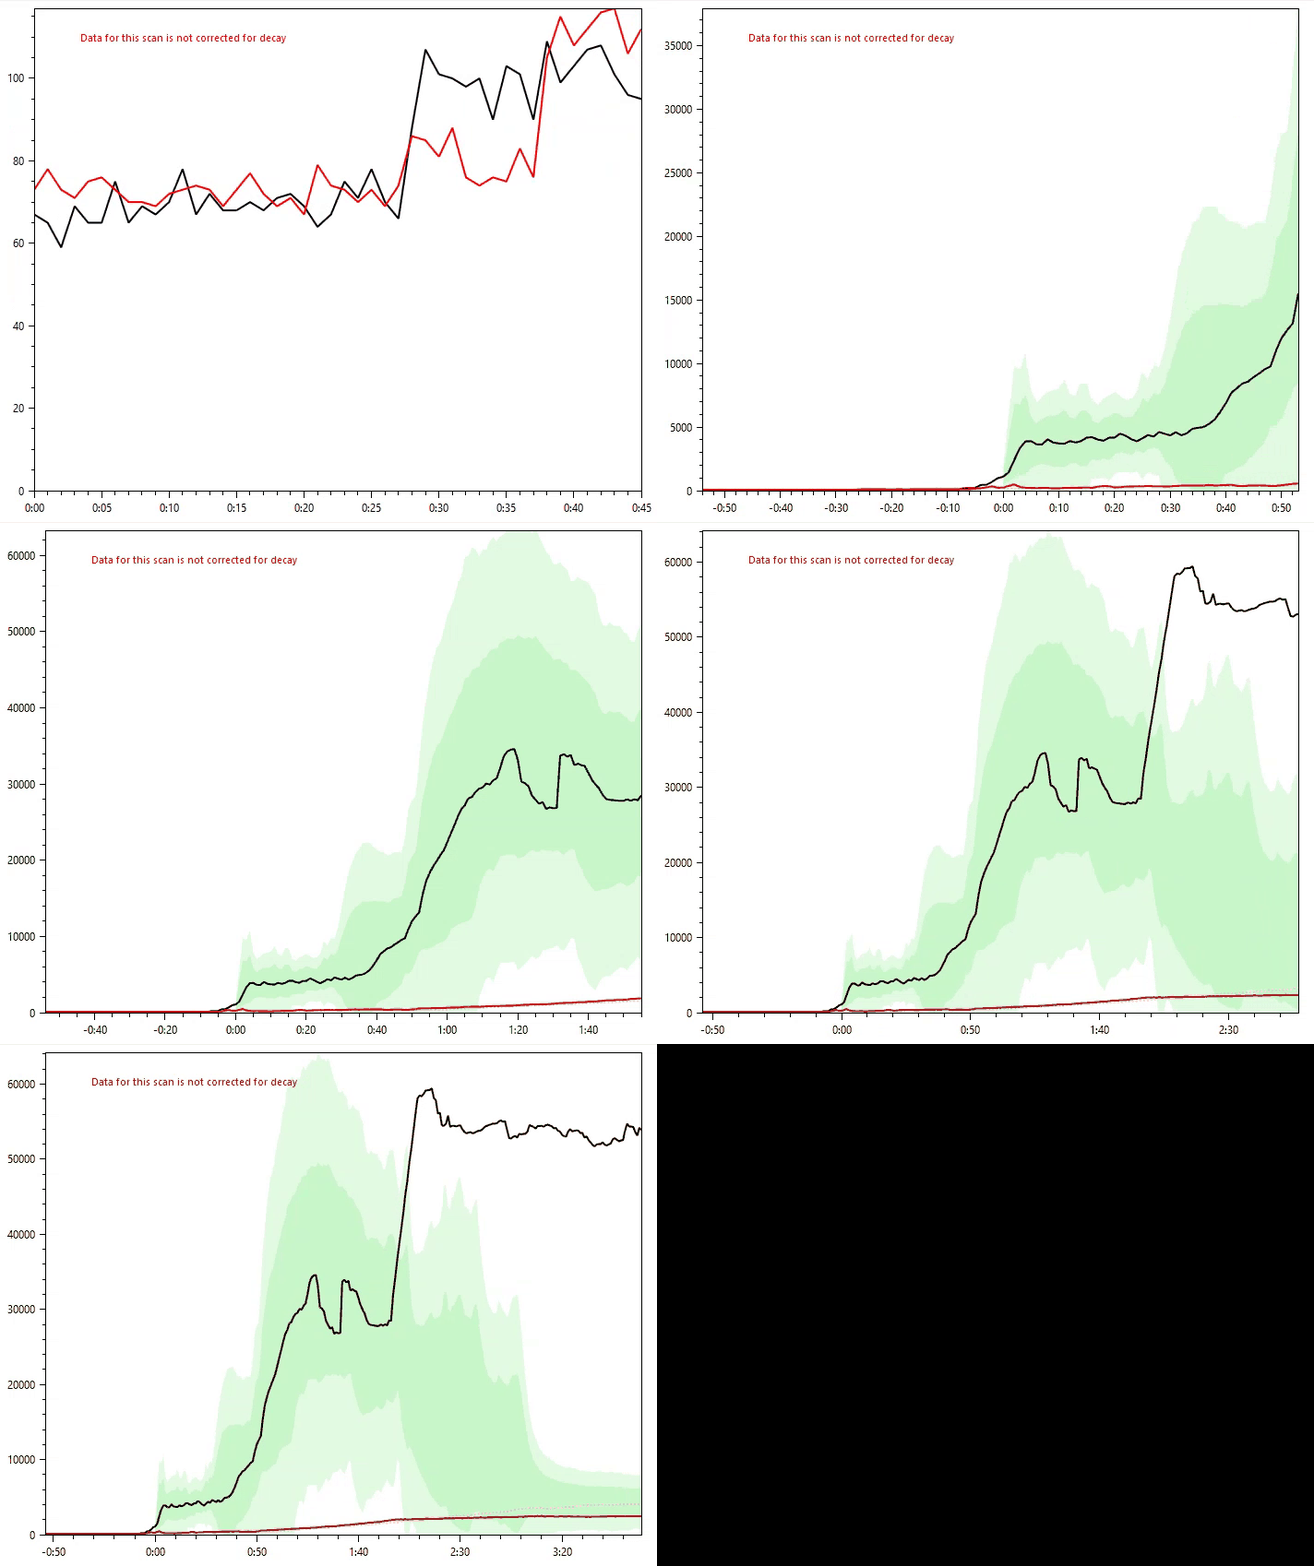
In this particular case, the technologist didn’t act. Upon seeing the Lara RTV TAC quickly deviating from the Control Chart, the technologist should have assessed the situation, paused the administration, and investigated why the TAC was not decreasing.
By pausing an administration as soon as extravasation is suspected, technologists can minimize the extent of extravasation, the absorbed dose to the patient tissue and overlying skin, and the effect of the misadministration to the overall procedure.
- Identify potential misadministration within seconds and pause administration
- Protect patient from unnecessary radiation exposure and ensure delivery of therapy
- Protect nuclear medicine centers from the cost of misadministered radiation and compromised therapy
